Chart pattern trading is one of the most popular forms of technical analysis because it helps traders understand market psychology through price action. Instead of relying solely on indicators, chart patterns allow traders to identify potential trend reversals, continuations, and breakout opportunities directly from a price chart.
Whether you trade forex, stocks, commodities, cryptocurrencies, or indices, chart patterns can provide valuable clues about where the market may move next. When combined with proper risk management and confirmation techniques, they can become a powerful part of any trading strategy.
This guide explains how chart pattern trading works, the most important patterns every trader should know, and practical ways to use them effectively in real market conditions.
What Is Chart Pattern Trading?
Chart pattern trading is a technical analysis approach that involves identifying recurring formations on price charts and using them to anticipate future market movements.
These patterns form because financial markets are driven by human behavior. Fear, greed, uncertainty, and confidence tend to repeat over time, causing price movements to create recognizable structures.
When traders identify these structures correctly, they can use them to:
- Spot potential trend reversals
- Identify trend continuation opportunities
- Anticipate breakouts
- Find high-probability entry points
- Establish logical stop-loss and take-profit levels
The key idea behind chart pattern trading is simple: history does not repeat exactly, but market behavior often rhymes.
Why Chart Patterns Work
Understanding why chart patterns work can help you trade them with greater confidence.
Markets are driven by supply and demand. Buyers push prices higher while sellers push prices lower. When these forces interact repeatedly, recognizable formations emerge.
A chart pattern is essentially a visual representation of market psychology.
For example, when buyers repeatedly fail to push prices above resistance, a bearish pattern may develop. When sellers fail to break support multiple times, a bullish pattern may form.
Chart patterns work because thousands of traders around the world recognize and react to similar price structures, creating self-reinforcing market behavior.
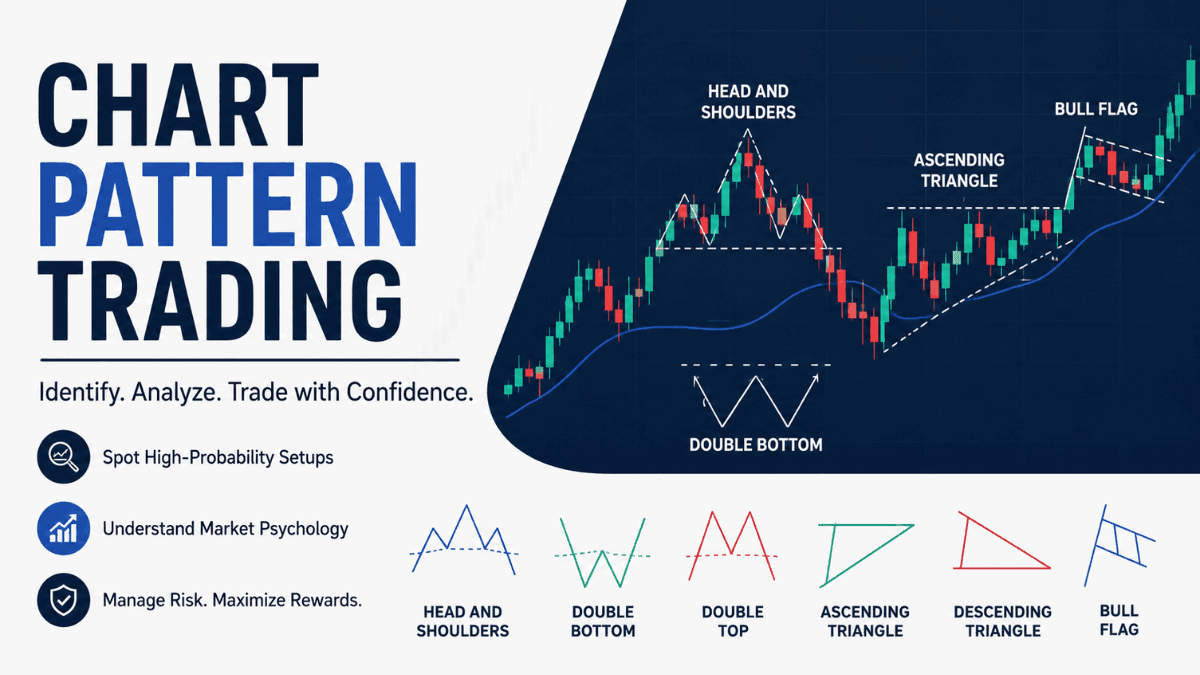
Types of Chart Patterns
Before diving into specific patterns, it is important to understand the two main categories.
Reversal Patterns
Reversal patterns suggest that the current trend may be ending and a new trend could begin.
A bullish reversal pattern signals a possible move from a downtrend to an uptrend. A bearish reversal pattern indicates a potential shift from an uptrend to a downtrend.
Common reversal patterns include:
- Head and Shoulders
- Inverse Head and Shoulders
- Double Top
- Double Bottom
- Triple Top
- Triple Bottom
Continuation Patterns
Continuation patterns suggest that an existing trend is likely to continue after a temporary pause or consolidation.
These patterns often appear during strong trends as traders take profits before the market resumes its original direction.
Common continuation patterns include:
- Flags
- Pennants
- Rectangles
- Ascending Triangles
- Descending Triangles
Head and Shoulders Pattern
Among all chart patterns, the Head and Shoulders pattern is one of the most reliable reversal formations.
It typically appears after an extended uptrend and signals a potential bearish reversal.
The pattern consists of:
- A left shoulder
- A higher peak called the head
- A right shoulder
- A neckline connecting support levels
When price breaks below the neckline, sellers often gain control, and the market may move lower.
Trading the Head and Shoulders Pattern
Traders generally wait for a confirmed neckline breakout before entering a short position.
A common approach is to place a stop-loss above the right shoulder and target a move equal to the distance between the head and neckline.
Patience matters here. Entering before the neckline breaks can lead to false signals.
Inverse Head and Shoulders Pattern
The Inverse Head and Shoulders is the bullish counterpart of the standard pattern.
It forms after a downtrend and suggests buyers are beginning to regain control.
The structure contains:
- Left shoulder
- Lower low forming the head
- Right shoulder
- Neckline resistance
A breakout above the neckline often signals the start of a bullish trend.
Trading the Inverse Head and Shoulders
Many traders enter after a confirmed breakout and retest of the neckline.
This approach reduces the risk of being caught in a false breakout while providing a clearer entry opportunity.
Double Top Pattern
The Double Top is a bearish reversal pattern that forms after an uptrend.
Price reaches resistance, pulls back, rallies again, and fails to break the previous high. This second rejection suggests buyers are losing momentum.
The pattern resembles the letter “M.”
Trading a Double Top
The key confirmation occurs when the price breaks below the support level between the two peaks.
Many traders use the height of the pattern to estimate a potential profit target.
Volume often decreases during the second peak, providing additional confirmation of weakening buying pressure.
Double Bottom Pattern
The Double Bottom is the opposite of the Double Top and signals a potential bullish reversal.
Price reaches support twice and fails to break lower. This suggests sellers are struggling to maintain control.
The formation resembles the letter “W.”
Trading a Double Bottom
A common strategy involves entering after price breaks above the resistance level separating the two lows.
Many traders wait for a retest before committing capital.
Triple Top and Triple Bottom Patterns
Triple Top and Triple Bottom patterns operate similarly to Double Tops and Double Bottoms but involve three attempts to break support or resistance.
These formations often indicate stronger reversal signals because the market repeatedly fails to continue in its original direction.
The more times a level successfully holds, the more attention traders typically give it.
Triangle Patterns
Triangle patterns are among the most common formations in chart pattern trading.
They represent periods of consolidation where price gradually compresses before eventually breaking out.
Ascending Triangle
An Ascending Triangle features:
- Flat resistance
- Rising support
This pattern is generally considered bullish because buyers continue pushing prices higher while resistance remains fixed.
A breakout above resistance often triggers further upside momentum.
Descending Triangle
A Descending Triangle contains:
- Flat support
- Falling resistance
This structure is typically bearish because sellers continue pressing prices lower while support remains unchanged.
A break below support can lead to strong downward movement.
Symmetrical Triangle
A Symmetrical Triangle forms when both support and resistance converge.
Neither buyers nor sellers have a clear advantage.
The eventual breakout direction determines the likely next move.
Flag Patterns
Flag patterns are continuation formations that appear during strong trends.
They consist of two components:
- A sharp directional move called the flagpole
- A small consolidation area called the flag
Flags indicate that traders are taking a brief pause before the trend potentially resumes.
Bull Flag
A Bull Flag develops during an uptrend.
After a strong upward move, the price consolidates slightly lower before breaking higher and continuing the trend.
Bear Flag
A Bear Flag develops during a downtrend.
Following a sharp decline, the price consolidates upward before resuming its downward movement.
Pennant Patterns
Pennants closely resemble flags but feature converging trendlines instead of parallel boundaries.
They form after strong price movements and usually signal continuation.
Because pennants represent short periods of consolidation, breakouts often occur relatively quickly.
Many traders combine breakout confirmation with volume analysis to improve accuracy.
Rectangle Patterns
Rectangle patterns occur when the price moves sideways between clearly defined support and resistance levels.
These patterns indicate a temporary equilibrium between buyers and sellers.
Eventually, one side gains control, and the price breaks out.
Trading Rectangles
Traders typically wait for a confirmed breakout before entering.
A breakout above resistance suggests bullish continuation, while a breakdown below support indicates bearish continuation.
How to Confirm Chart Patterns
Recognizing a pattern is only part of the process. Confirmation helps improve trade quality.
Several methods can strengthen a chart pattern signal.
Volume Analysis
Volume measures trading activity.
A breakout accompanied by increased volume often carries greater credibility than a breakout occurring on weak volume.
Strong participation suggests conviction among market participants.
Support and Resistance
Patterns that align with major support or resistance levels tend to have greater significance.
Institutional traders often pay close attention to these areas.
Trend Analysis
Trading patterns in the direction of the broader trend generally improve the probability.
For example, bullish continuation patterns often perform better during established uptrends.
Candlestick Confirmation
Bullish or bearish candlestick formations near pattern breakout points can provide additional confidence.
Examples include bullish engulfing candles, bearish engulfing candles, pin bars, and rejection candles.
Risk Management in Chart Pattern Trading
Even the best chart patterns fail occasionally.
This is why risk management is more important than finding the perfect setup.
Consider these principles:
- Risk only a small percentage of your account per trade
- Always use a stop-loss
- Avoid overtrading
- Wait for confirmation
- Maintain favorable risk-to-reward ratios
Many professional traders focus more on controlling losses than maximizing wins.
A pattern with a 50% win rate can still be profitable if winners are larger than losers.
Common Mistakes Traders Make
Many beginners struggle with chart pattern trading because they rush into trades or misinterpret formations.
Some of the most common mistakes include:
- Trading incomplete patterns
- Ignoring confirmation signals
- Forcing patterns where none exist
- Neglecting risk management
- Trading against major trends
- Entering before breakouts occur
Successful traders understand that not every chart contains a valid pattern. Sometimes the best trade is no trade at all.
Best Markets for Chart Pattern Trading
One of the biggest advantages of chart pattern trading is its versatility.
Chart patterns can be applied to:
- Forex markets
- Stock markets
- Cryptocurrency markets
- Commodities
- Indices
- Futures markets
Since chart patterns are based on human behavior and market psychology, they tend to appear across virtually all liquid financial markets.
How to Build a Chart Pattern Trading Strategy
A strong strategy combines pattern recognition with confirmation and risk management.
A simple framework might include:
- Identify the prevailing trend.
- Wait for a high-quality chart pattern.
- Mark the support and resistance levels.
- Confirm the breakout.
- Set a logical stop-loss.
- Define a realistic profit target.
- Manage risk consistently.
This structured approach helps eliminate emotional decision-making and improve long-term consistency.
Final Thoughts
Chart pattern trading remains one of the most effective ways to analyze market behavior because it focuses directly on price action. The patterns themselves are not magic formulas, but they provide valuable insights into the ongoing battle between buyers and sellers.
The most successful traders do not rely solely on patterns. They combine them with trend analysis, support and resistance, volume confirmation, and disciplined risk management. Over time, this combination creates a repeatable process that can help traders identify high-probability opportunities while protecting their capital.
Mastering chart pattern trading takes practice, screen time, and patience. Start by learning a few key patterns thoroughly rather than trying to memorize dozens at once. As your experience grows, you’ll begin recognizing these formations naturally and using them with greater confidence in live market conditions.
Trade Anytime, Anywhere with XM
Take your trading to the next level with a globally trusted forex and CFD broker. Enjoy competitive spreads, fast execution, and reliable customer support while trading securely.
With XM, you get access to powerful trading platforms, real-time charts, flexible account types, and advanced tools to help you analyze the markets and manage your trades efficiently. Start your journey today by opening a trading account for free and join millions of traders worldwide.
✅ Open an Account with XMVincent Nyagaka has been trading and analyzing markets for over 10+ years. He is a respected trader, author, and coach in financial markets, and is known as the authority on price action trading. At Eazypips, he shares practical strategies and trading lessons to guide aspiring traders toward consistent results.