Trendline Trading is one of the simplest yet most effective forms of technical analysis. Whether you trade forex, stocks, commodities, or cryptocurrencies, trendlines help you identify market direction, spot potential entry points, and anticipate reversals before they become obvious to everyone else.
Many traders overlook trendlines because they appear too basic. That is often a mistake. Some of the most successful traders use trendlines as part of their daily analysis because they provide a clear visual representation of market structure. When drawn correctly, they can help you stay aligned with the trend and avoid costly trades against market momentum.
In this guide, you’ll learn what trendline trading is, how to draw trendlines properly, common mistakes to avoid, and practical strategies you can apply immediately.
What Is Trendline Trading?
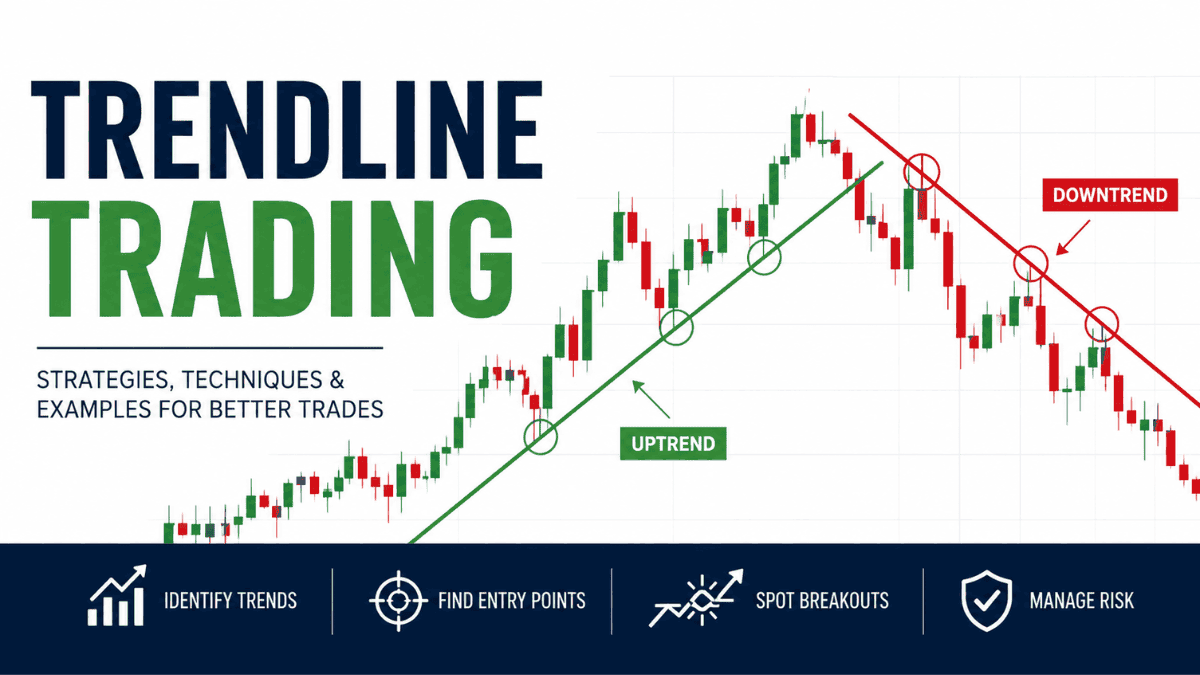
Trendline trading is a technical analysis method that uses diagonal lines to connect important price highs or lows on a chart. These lines help traders identify the direction of a market trend and potential areas where the price may react.
A trendline acts as a dynamic support or resistance level. Unlike horizontal support and resistance zones, trendlines move with the market over time.
There are two primary types of trendlines:
- Uptrend lines
- Downtrend lines
When traders understand how price interacts with these lines, they can identify trading opportunities with greater confidence.
Why Trendlines Matter in Trading
Trendlines offer a simple way to understand market behavior without cluttering charts with dozens of indicators.
Price rarely moves in a straight line. Markets advance, pull back, and continue moving in waves. Trendlines help traders visualize these waves and determine whether buyers or sellers remain in control.
Key benefits of trendline trading include:
- Identifying the overall trend direction
- Finding potential entry points
- Spotting breakout opportunities
- Improving risk-to-reward ratios
- Confirming other technical signals
Many traders combine trendlines with candlestick patterns, support and resistance zones, moving averages, and momentum indicators for stronger trade setups.
Understanding Market Trends
Before drawing trendlines, you need to understand what defines a trend.
A trend is the general direction in which a market is moving over time.
Uptrend
An uptrend occurs when the price creates higher highs and higher lows.
Buyers consistently push the market upward, while pullbacks remain relatively shallow. During an uptrend, trendlines are drawn beneath price action by connecting significant swing lows.
Downtrend
A downtrend occurs when the price forms lower highs and lower lows.
Sellers dominate the market, causing prices to decline over time. Trendlines are drawn above price action by connecting significant swing highs.
Sideways Market
Not every market is trending.
Sometimes price moves within a range, creating neither higher highs nor lower lows. During these periods, trendline trading becomes less effective, and traders often focus on horizontal support and resistance levels instead.
How to Draw Trendlines Correctly
Drawing trendlines is easy in theory but challenging in practice. Small mistakes can significantly affect trading decisions.
Drawing a Uptrend Line
To draw an uptrend line:
- Identify at least two significant swing lows.
- Connect those lows using a straight line.
- Extend the line into future price action.
The more times the price respects the trendline without breaking it, the stronger the trendline becomes.
Drawing a Downtrend Line
To draw a downtrend line:
- Locate two significant swing highs.
- Connect them with a straight line.
- Extend the line forward.
Repeated reactions at the trendline increase its reliability.
Should You Use Wicks or Candle Bodies?
This is one of the most common questions in technical analysis.
There is no universal rule. Many traders prefer connecting candle wicks because they represent the full range of price movement. Others use candle bodies to reduce noise.
The key is consistency. Use the same approach across your analysis to avoid confusion.
Characteristics of a Strong Trendline
Not all trendlines are equally valuable. Some deserve more attention than others.
A strong trendline usually has several characteristics:
- Three or more valid touches
- Clear separation between touch points
- Minimal forced adjustments
- Visible on higher timeframes
- Strong reactions to the price
Trendlines that require excessive tweaking are often unreliable.
If you need to convince yourself that a trendline exists, it probably doesn’t.
Trendline Trading Strategies
Once you’ve learned how to draw trendlines, the next step is using them to find trading opportunities.
Trendline Bounce Strategy
This is one of the most popular trendline trading approaches.
The idea is simple. When the price approaches a trendline in a healthy trend, traders look for evidence that the trend will continue.
In an uptrend, traders watch for bullish signals near the trendline. In a downtrend, they look for bearish confirmation.
Potential confirmations include:
- Bullish engulfing candles
- Bearish engulfing candles
- Pin bars
- Inside bar breakouts
- Momentum indicator confirmation
The goal is to enter the trade as price rejects the trendline and resumes the primary trend.
Trendline Breakout Strategy
Trendlines do not last forever.
Eventually, buyers or sellers lose control, causing the price to break through the trendline.
A breakout strategy focuses on capturing these transitions.
Rather than entering immediately after the break, experienced traders often wait for confirmation. This reduces the likelihood of getting caught in a false breakout.
Common confirmation signals include:
- Strong breakout candles
- Increased trading volume
- Retests of the broken trendline
- Market structure shifts
Patience often improves the quality of breakout trades.
Trendline Retest Strategy
Many professional traders prefer retests over initial breakouts.
After price breaks a trendline, it frequently returns to test the broken area before continuing in the new direction.
This retest creates an opportunity to enter with a tighter stop-loss and potentially better risk-to-reward ratio.
The setup becomes even stronger when the retest aligns with support, resistance, or a key Fibonacci level.
Combining Trendlines With Other Tools
Trendlines become significantly more powerful when combined with complementary analysis methods.
Trendlines and Support and Resistance
When a trendline intersects with a major support or resistance zone, the area becomes more important.
This type of confluence often attracts additional market participants, increasing the likelihood of a meaningful reaction.
Trendlines and Moving Averages
Moving averages help traders measure trend strength.
When price approaches both a trendline and a major moving average simultaneously, the setup often gains additional credibility.
Many traders use the 50-period and 200-period moving averages for this purpose.
Trendlines and RSI
The Relative Strength Index (RSI) measures momentum.
If price reaches a trendline while RSI shows overbought or oversold conditions, traders may gain additional insight into potential reversals or continuations.
Trendlines and Candlestick Patterns
Candlestick patterns can provide valuable confirmation.
Examples include:
- Hammer patterns
- Shooting stars
- Engulfing patterns
- Morning stars
- Evening stars
A trendline touch combined with a strong candlestick signal often creates a high-quality trading setup.
Common Trendline Trading Mistakes
Even experienced traders occasionally misuse trendlines.
Forcing Trendlines
One of the biggest mistakes is forcing lines to fit price action.
Trendlines should naturally connect significant highs or lows. If a line only works after multiple adjustments, it probably lacks validity.
Trading Every Touch
Not every trendline touch deserves a trade.
Markets are dynamic, and some touches occur during periods of low momentum or uncertainty. Waiting for confirmation often improves trading results.
Ignoring Market Context
Trendlines should never be used in isolation.
Economic news, higher timeframe trends, market sentiment, and major support or resistance levels can significantly influence price behavior.
Using Extremely Steep Trendlines
Steep trendlines often break quickly because they represent unsustainable momentum.
More gradual trendlines tend to provide more reliable signals over time.
Best Timeframes for Trendline Trading
Trendlines work across virtually every timeframe.
However, some timeframes generally produce more reliable signals than others.
Higher Timeframes
Daily and four-hour charts typically produce cleaner trendlines.
Price movements on these charts contain less market noise and are often more respected by institutional traders.
Lower Timeframes
Five-minute and fifteen-minute charts can still be used for trendline trading.
The challenge is that lower timeframes generate more false breakouts and less reliable signals.
Many traders analyze higher timeframes first and then use lower timeframes for precise entries.
Risk Management for Trendline Traders
Even the best trendline setup can fail.
That is why risk management matters more than finding perfect entries.
Consider the following principles:
- Risk only a small percentage of your account per trade
- Always use a stop-loss
- Avoid overleveraging
- Maintain favorable risk-to-reward ratios
- Never move stop-losses emotionally
Successful traders understand that losses are part of the business. The objective is not to win every trade but to manage risk effectively over hundreds of trades.
Example of a Trendline Trading Setup
Imagine EUR/USD is in a clear uptrend.
Price creates several higher lows, allowing you to draw a valid upward trendline. After a pullback, the price touches the trendline while forming a bullish engulfing candle.
At the same time, the area aligns with a previous support level and the 50-period moving average.
This combination of factors creates a high-probability setup. A trader might enter long, place a stop-loss below the trendline, and target the next major resistance level.
Notice that the trade is not based solely on the trendline. It relies on multiple layers of confirmation.
Is Trendline Trading Effective?
Trendline trading remains effective because it reflects how markets naturally move.
Institutional traders, hedge funds, and retail traders all pay attention to market structure. Trendlines help visualize that structure simply and intuitively.
No strategy works 100% of the time. Trendlines occasionally produce false signals, especially during volatile news events or low-liquidity periods.
Their real value comes from helping traders identify trends, improve entries, and manage risk within a structured trading plan.
Conclusion
Trendline Trading is one of the most versatile and practical technical analysis techniques available to traders. It helps identify trends, locate potential entry points, spot breakout opportunities, and understand market structure with minimal chart clutter.
The key to success is drawing trendlines correctly, waiting for confirmation, and combining them with other forms of analysis rather than relying on them alone. When used alongside sound risk management and disciplined execution, trendlines can become a valuable part of your trading toolkit.
Whether you’re trading forex, stocks, indices, commodities, or cryptocurrencies, mastering trendline trading can help you make more informed decisions and stay aligned with the market’s dominant direction.
Trade Anytime, Anywhere with XM
Take your trading to the next level with a globally trusted forex and CFD broker. Enjoy competitive spreads, fast execution, and reliable customer support while trading securely.
With XM, you get access to powerful trading platforms, real-time charts, flexible account types, and advanced tools to help you analyze the markets and manage your trades efficiently. Start your journey today by opening a trading account for free and join millions of traders worldwide.
✅ Open an Account with XMVincent Nyagaka has been trading and analyzing markets for over 10+ years. He is a respected trader, author, and coach in financial markets, and is known as the authority on price action trading. At Eazypips, he shares practical strategies and trading lessons to guide aspiring traders toward consistent results.