RSI Divergence is one of the most popular and effective techniques traders use to identify potential market reversals and trend continuation opportunities. While many traders focus solely on price action, RSI divergence helps reveal what is happening beneath the surface by comparing price movement with momentum.
When used correctly, RSI divergence can provide early warning signs that a trend is losing strength before the market changes direction. Whether you trade forex, stocks, commodities, cryptocurrencies, or indices, understanding RSI divergence can significantly improve your market analysis and trade timing.
What Is RSI Divergence?
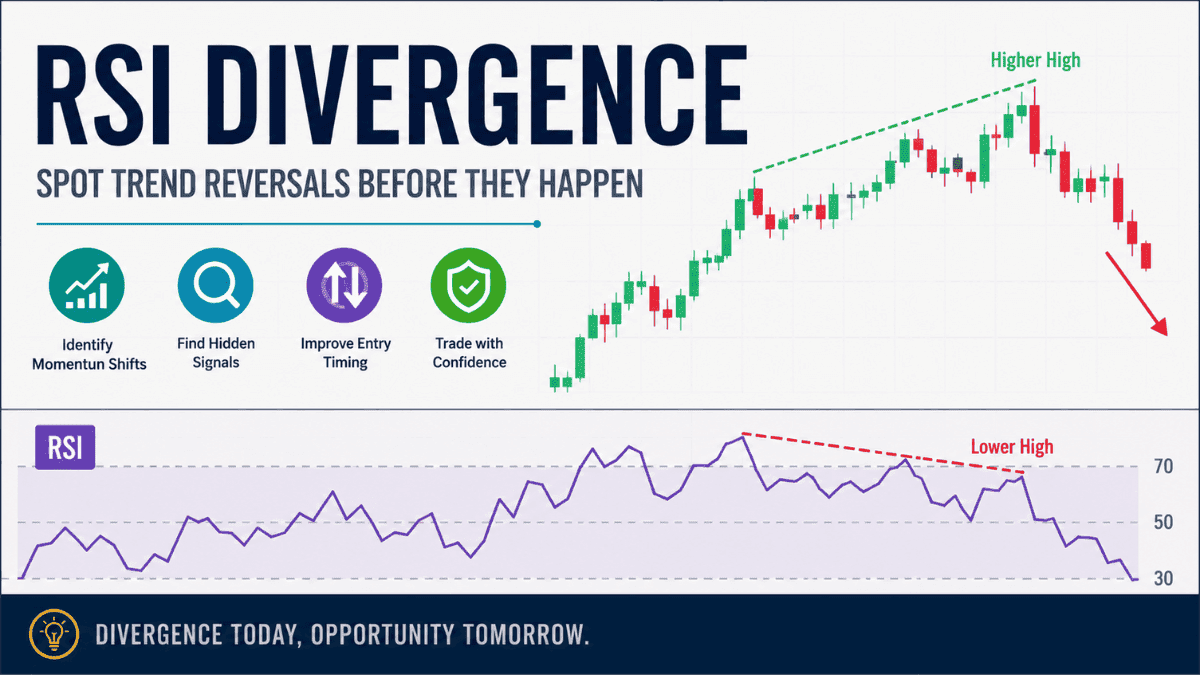
RSI divergence occurs when the price moves in one direction while the Relative Strength Index (RSI) moves in the opposite direction. This disagreement between price and momentum often signals that the current trend may be weakening.
The RSI, developed by J. Welles Wilder Jr., is a momentum indicator that measures the speed and magnitude of recent price changes. It oscillates between 0 and 100 and is commonly used to identify overbought and oversold market conditions.
When price and RSI stop moving in sync, traders pay close attention because momentum often shifts before price does.
Understanding How RSI Works
Before diving deeper into divergence, it helps to understand what RSI actually measures.
RSI evaluates the strength of recent gains compared to recent losses over a specific period, typically 14 periods. The indicator generates values between 0 and 100.
Common RSI levels include:
- Above 70: Potentially overbought market
- Below 30: Potentially oversold market
- Around 50: Neutral momentum
- Rising RSI: Increasing bullish momentum
- Falling RSI: Increasing bearish momentum
Many beginners assume RSI should only be used to identify overbought and oversold conditions. In reality, divergence analysis is often far more valuable because it can reveal momentum shifts before they become obvious on the price chart.
Why RSI Divergence Matters
The real value of RSI divergence lies in its ability to expose hidden weakness or strength in a trend.
Imagine a market making new highs. At first glance, everything looks bullish. However, if RSI is making lower highs during the same period, buying momentum is actually declining. The market may still be rising, but the engine driving the move is running out of fuel.
This is exactly what divergence helps traders identify.
Instead of reacting after a reversal occurs, traders can prepare for potential changes in market direction before they happen.
Types of RSI Divergence
Understanding the different forms of RSI divergence is critical because each one provides different information about market conditions.
Regular Bullish Divergence
Regular bullish divergence occurs when the price makes a lower low while the RSI forms a higher low.
This suggests that although price continues to fall, bearish momentum is weakening. Sellers are losing control, which increases the possibility of a bullish reversal.
Example
Suppose EUR/USD falls from 1.1000 to 1.0900 and then rebounds slightly.
The market later drops again to 1.0850, creating a lower low. However, RSI forms a higher low instead of following the price lower.
This disagreement indicates weakening selling pressure and may signal an upcoming upward move.
Regular Bearish Divergence
Regular bearish divergence occurs when the price makes a higher high while the RSI creates a lower high.
The market continues to rise, but momentum fails to keep pace. Buyers are becoming less aggressive, increasing the likelihood of a bearish reversal.
Example
Gold rallies from $3,300 to $3,400.
After a brief pullback, the price pushes to $3,450, creating a higher high. Meanwhile, RSI forms a lower high.
This divergence suggests that bullish momentum is fading and a downward correction could follow.
Hidden Bullish Divergence
Hidden bullish divergence typically appears during an uptrend.
Price forms a higher low while RSI creates a lower low.
Rather than signaling a reversal, hidden bullish divergence often suggests trend continuation.
Example
A stock is trending upward.
Price retraces and creates a higher low compared to the previous swing low. RSI, however, drops below its previous low.
The underlying trend remains strong despite temporary weakness, increasing the probability of another move higher.
Hidden Bearish Divergence
Hidden bearish divergence appears during a downtrend.
Price forms a lower high while RSI creates a higher high.
This often signals that the existing downtrend is likely to continue.
Example
A cryptocurrency is trending lower.
Price rallies temporarily but forms a lower high. At the same time, RSI forms a higher high.
This indicates the correction may be ending, and the downtrend could soon resume.
RSI Divergence vs Regular RSI Signals
Many traders rely solely on overbought and oversold readings. While these signals can be useful, divergence often provides deeper insights.
Consider a strong uptrend. RSI may remain above 70 for an extended period.
A trader using only overbought readings might repeatedly sell too early.
A trader watching divergence, however, waits until momentum actually begins weakening. This approach often produces more reliable signals and reduces premature entries.
How to Identify RSI Divergence Correctly
Spotting divergence sounds simple, but many traders misidentify it.
The key is to compare meaningful swing highs and swing lows rather than random market fluctuations.
Follow these steps:
- Identify clear swing highs or lows on the price chart.
- Locate the corresponding highs or lows on RSI.
- Compare the direction of price with the direction of RSI.
- Confirm divergence using market structure.
- Wait for additional confirmation before entering a trade.
Patience is essential. Divergence alone is not a guaranteed trading signal.
Best Timeframes for RSI Divergence
RSI divergence can appear on virtually any timeframe.
However, reliability generally increases on higher timeframes because they contain less market noise.
Scalping Timeframes
One-minute and five-minute charts frequently generate divergence signals.
While opportunities are abundant, false signals are also common.
Intraday Trading Timeframes
Fifteen-minute, thirty-minute, and one-hour charts often provide a balance between signal frequency and reliability.
Many day traders prefer these timeframes.
Swing Trading Timeframes
Four-hour, daily, and weekly charts tend to produce stronger divergence setups.
Signals occur less frequently but often lead to larger market moves.
Combining RSI Divergence With Price Action
The strongest divergence setups usually occur when they align with price action analysis.
Price action refers to the study of raw market movement without relying heavily on indicators.
Useful confirmations include:
- Support and resistance zones
- Trend lines
- Chart patterns
- Breakouts
- Rejection candles
- Market structure shifts
When divergence appears at a major support or resistance level, the probability of a successful trade generally increases.
Combining RSI Divergence With Other Indicators
While RSI divergence can be powerful on its own, combining it with complementary indicators may improve accuracy.
Moving Averages
Moving averages help identify the dominant trend.
Bullish divergence occurring above a rising moving average often carries more weight than divergence appearing in a weak market.
MACD
The MACD is another momentum indicator.
When both RSI divergence and MACD divergence appear together, traders often view the signal as stronger.
Volume Analysis
Volume reveals market participation.
A bullish divergence supported by increasing buying volume can provide additional confidence.
Common RSI Divergence Mistakes
Many traders struggle with divergence because they make avoidable mistakes.
Trading Every Divergence Signal
Not all divergences lead to reversals.
Some disappear as trends continue strongly.
Waiting for confirmation helps filter weaker setups.
Ignoring Market Structure
A bullish divergence against a powerful downtrend may fail repeatedly.
Always analyze the broader market context.
Entering Too Early
Divergence can develop long before the price actually reverses.
Many traders lose money by entering prematurely.
Waiting for confirmation, candles or structural breaks can improve results.
Using RSI Alone
No indicator is perfect.
Combining RSI divergence with price action and risk management creates a more balanced trading approach.
A Practical RSI Divergence Trading Strategy
A simple RSI divergence strategy can help traders apply the concept consistently.
Step 1: Identify Trend Direction
Determine whether the market is trending or ranging.
Understanding context improves decision-making.
Step 2: Locate Divergence
Compare recent swing highs or lows with RSI readings.
Look for clear divergence patterns.
Step 3: Wait for Confirmation
Confirmation may come from:
- Break of the trend line
- Candlestick reversal pattern
- Breakdown of market structure
- Strong support or resistance reaction
Step 4: Enter the Trade
Enter only after confirmation appears.
Avoid anticipating the reversal.
Step 5: Manage Risk
Place stop-loss orders logically based on market structure.
Many successful traders focus more on risk management than signal accuracy.
Does RSI Divergence Work in Forex Trading?
Yes, RSI divergence remains widely used in forex trading because currency markets are highly influenced by momentum.
Major currency pairs such as EUR/USD, GBP/USD, USD/JPY, and AUD/USD regularly produce divergence opportunities.
That said, divergence should not be treated as a standalone trading system. Economic news, central bank decisions, and market sentiment can override technical signals.
Does RSI Divergence Work in Cryptocurrency Markets?
Cryptocurrency markets frequently produce strong divergence signals due to their volatility.
Digital assets often experience emotional buying and selling cycles that create visible momentum discrepancies.
Many crypto traders use RSI divergence on four-hour and daily charts to identify potential trend reversals before they become obvious.
Advantages of RSI Divergence
Every trading tool has strengths, and RSI divergence offers several notable benefits.
- Helps identify potential reversals early
- Works across multiple asset classes
- Can be used on different timeframes
- Complements price action analysis
- Improves understanding of momentum
- Relatively easy to learn
These advantages explain why RSI divergence remains popular among both retail and professional traders.
Limitations of RSI Divergence
Despite its strengths, divergence is not infallible.
Markets can remain irrational longer than traders expect.
Some limitations include:
- False signals during strong trends
- Delayed entries when waiting for confirmation
- Subjective interpretation
- Reduced effectiveness in highly volatile news events
Recognizing these limitations helps traders maintain realistic expectations.
Final Thoughts
RSI divergence is one of the most valuable momentum analysis techniques available to traders. By comparing price action with the Relative Strength Index, traders can identify weakening trends, potential reversals, and continuation opportunities that may not be visible through price alone.
The most successful traders do not use RSI divergence in isolation. Instead, they combine it with market structure, support and resistance, trend analysis, and disciplined risk management. When used within a complete trading plan, RSI divergence can become a powerful tool for improving trade timing and decision-making.
Rather than treating every divergence as a guaranteed signal, focus on quality setups, confirmation, and consistency. Over time, this approach can help you use RSI divergence more effectively across forex, stocks, commodities, and cryptocurrency markets.
Frequently Asked Questions About RSI divergence
RSI divergence can be highly effective when combined with confirmation tools such as support and resistance, candlestick patterns, and trend analysis. It should not be used as a standalone signal.
The default 14-period RSI is the most commonly used setting and works well for most traders. Some short-term traders experiment with lower settings for faster signals.
RSI divergence can indicate that momentum is weakening and that a reversal is possible. However, it does not guarantee a reversal will occur.
Regular divergence often signals a potential trend reversal, while hidden divergence typically suggests continuation of the existing trend.
Yes. RSI divergence can be applied to forex, stocks, commodities, cryptocurrencies, indices, and other financial markets because it measures momentum rather than a specific asset type.
Yes. RSI divergence is relatively easy to understand and can help beginners develop a deeper understanding of market momentum, provided they also learn proper risk management and price action analysis.
Trade Anytime, Anywhere with XM
Take your trading to the next level with a globally trusted forex and CFD broker. Enjoy competitive spreads, fast execution, and reliable customer support while trading securely.
With XM, you get access to powerful trading platforms, real-time charts, flexible account types, and advanced tools to help you analyze the markets and manage your trades efficiently. Start your journey today by opening a trading account for free and join millions of traders worldwide.
✅ Open an Account with XMVincent Nyagaka has been trading and analyzing markets for over 10+ years. He is a respected trader, author, and coach in financial markets, and is known as the authority on price action trading. At Eazypips, he shares practical strategies and trading lessons to guide aspiring traders toward consistent results.