Renko Charts are a price-based charting method designed to filter out market noise and make trends easier to see. Instead of plotting price movement against time, Renko Charts focus only on meaningful price changes, which helps traders concentrate on direction rather than short-term fluctuations.
This approach is especially useful for traders who struggle with cluttered charts or false signals. By removing time from the equation, Renko Charts present price action in a simplified and structured way that highlights trend strength and potential reversals.
- What Are Renko Charts?
- How Renko Charts Work
- Key Differences Between Renko Charts and Candlestick Charts
- Advantages of Using Renko Charts
- Limitations of Renko Charts
- Renko Charts and Market Noise
- Common Renko Chart Trading Strategies
- Best Markets and Timeframes for Renko Charts
- Renko Charts for Beginners
- Risk Management When Trading Renko Charts
- Are Renko Charts Reliable?
- Final Thoughts
What Are Renko Charts?
Renko Charts are built using fixed-size blocks, often called “bricks,” that form only when the price moves a specified amount. Each brick represents a predefined price movement, not a specific time period, which makes these charts fundamentally different from candlestick or bar charts.
The name “Renko” comes from the Japanese word renga, meaning brick. This naming reflects the visual structure of the chart, where bricks stack upward or downward to show price direction without the distraction of time-based volatility.
How Renko Charts Work
Renko Charts operate on a simple rule: a new brick appears only when the price moves enough to justify it. This rule ensures that minor price fluctuations are ignored, allowing traders to focus on clearer market movements.
Brick Size and Its Role
Brick size is the most important setting in a Renko Chart because it determines how sensitive the chart is to price changes. A smaller brick size produces more bricks and captures shorter-term movements, while a larger brick size smooths the chart and highlights major trends.
Choosing the right brick size depends on the market, timeframe, and trading style. Many traders adjust brick size based on volatility to ensure the chart reflects meaningful price action.
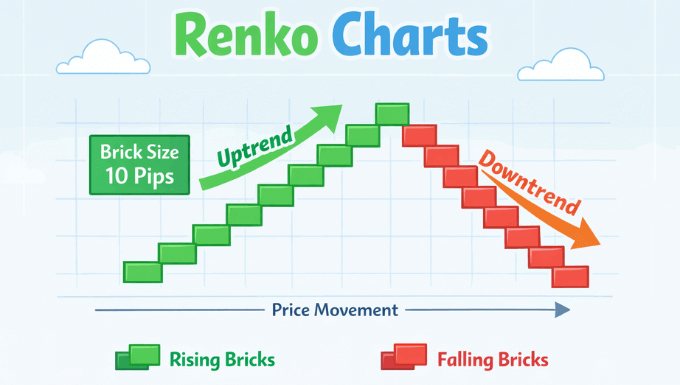
Direction and Color of Bricks
Each Renko brick represents a directional move. Upward bricks form when the price rises by the chosen brick size, while downward bricks appear when the price falls by the same amount.
Color coding is commonly used to improve clarity, with one color for upward movement and another for downward movement. This visual simplicity helps traders quickly identify trend direction without interpretation fatigue.
Key Differences Between Renko Charts and Candlestick Charts
Renko Charts differ from traditional candlestick charts in both construction and purpose. While candlesticks show open, high, low, and close prices over time, Renko Charts display only price movement that exceeds a set threshold.
This difference means Renko Charts often look cleaner and less emotional. Candlestick charts can exaggerate noise during low-liquidity or sideways markets, while Renko Charts remain calm until the price truly moves.
Advantages of Using Renko Charts
Renko Charts offer several benefits that appeal to both beginner and experienced traders. These advantages stem mainly from their ability to reduce noise and emphasize structure.
- Clearer trend identification due to filtered price movement
- Reduced emotional decision-making caused by small price swings
- Easier visualization of support, resistance, and trend changes
These strengths make Renko Charts particularly effective for trend-following strategies and disciplined trading approaches.
Limitations of Renko Charts
Despite their strengths, Renko Charts are not perfect and should not be used blindly. Because they ignore time, they can lag behind fast market moves, especially during high-impact news events.
Another limitation is that price gaps may not be immediately visible. Traders who rely heavily on time-based context or intraday volatility should be aware that Renko Charts intentionally hide those details.
Renko Charts and Market Noise
One of the main reasons traders adopt Renko Charts is their ability to filter market noise. Noise refers to random price movements that do not reflect true supply and demand changes.
By ignoring insignificant price movements, Renko Charts help traders avoid overreacting to minor fluctuations. This clarity often leads to more confident decisions and fewer impulsive trades.
Common Renko Chart Trading Strategies
Renko Charts can support a wide range of trading strategies when used correctly. Their clean structure makes them especially suitable for rule-based approaches.
Trend-Following with Renko Charts
Trend-following is one of the most popular uses of Renko Charts. A series of bricks in the same direction signals a strong trend, while a change in direction may suggest a possible reversal.
Traders often wait for multiple bricks to confirm a trend before entering a trade. This confirmation reduces the likelihood of entering during temporary pullbacks.
Support and Resistance on Renko Charts
Support and resistance levels are often easier to spot on Renko Charts because price action is simplified. Horizontal areas where bricks repeatedly change direction can highlight key price zones.
These levels can be used for entries, exits, or stop placement, especially when combined with a broader market context.
Using Indicators with Renko Charts
Although Renko Charts are simple, they can still work well with technical indicators. Moving averages, RSI, and MACD are commonly applied to confirm trend strength or momentum.
It is important to use indicators sparingly. The strength of Renko Charts lies in clarity, and overcrowding them with tools can defeat their purpose.
Best Markets and Timeframes for Renko Charts
Renko Charts work best in markets with consistent volatility and clear directional movement. Forex, commodities, and major stock indices are popular choices among Renko traders.
There is no fixed timeframe for Renko Charts, as they are not time-based. However, traders should align brick size with their trading horizon to ensure the chart reflects meaningful price behavior.
Renko Charts for Beginners
For beginners, Renko Charts offer a gentler introduction to price action analysis. Their simplified structure makes it easier to understand trends, reversals, and key levels without being overwhelmed.
New traders should start by practicing on historical data. This approach helps build confidence and shows how Renko Charts behave in different market conditions.
Risk Management When Trading Renko Charts
Risk management remains essential when using Renko Charts. Clear trends do not guarantee profitable outcomes, and losses are still part of trading.
Traders should define risk before entering any position, using logical stop placements and realistic position sizing. Renko Charts can help with structure, but discipline protects capital.
Are Renko Charts Reliable?
Renko Charts are reliable when used for the purpose they are designed for: trend clarity and noise reduction. They are not predictive tools, but visual frameworks that support better decision-making.
Their reliability improves when combined with sound analysis, proper risk management, and realistic expectations. No chart type replaces experience or discipline.
Final Thoughts
Renko Charts offer a clean and structured way to view price action by focusing on what matters most: meaningful movement. By removing time-based noise, they help traders see trends more clearly and act with greater confidence.
Used thoughtfully, Renko Charts can become a valuable part of a trader’s toolkit. They reward patience, discipline, and clarity—qualities that matter far more than any single indicator or strategy.
Vincent Nyagaka has been trading and analyzing markets for over 10+ years. He is a respected trader, author, and coach in financial markets, and is known as the authority on price action trading. At Eazypips, he shares practical strategies and trading lessons to guide aspiring traders toward consistent results.