A hammer candlestick is a popular price-action pattern that signals a potential bullish reversal after a decline. It appears when sellers push prices sharply lower during a session, but buyers step in strongly and force the price to close near the opening level. This shift in control often reflects fading selling pressure and growing buyer confidence, which is why the hammer candlestick is widely used in forex, stocks, crypto, and commodities trading.
To use this pattern effectively, traders must understand not only how it looks but also where it appears, what it represents psychologically, and how to confirm it with other tools. This guide breaks the hammer candlestick down step by step so you can apply it with clarity and confidence.
What Is a Hammer Candlestick?
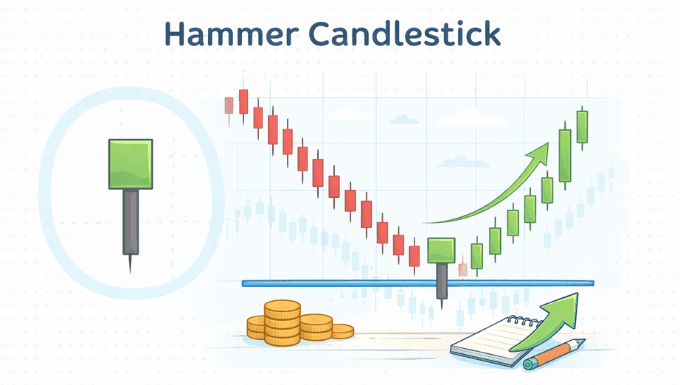
A hammer candlestick is a single-candle pattern that forms after a sustained downtrend and hints at a possible trend reversal. Its shape reflects a failed attempt by sellers to continue pushing the market lower.
The candle has a small real body near the top of the price range and a long lower shadow. This structure shows that although prices fell sharply during the session, buyers regained control before the close.
Key Characteristics of a Hammer Candlestick
To correctly identify a hammer candlestick, traders focus on its structure rather than its color. The proportions of the candle matter more than whether it closes bullish or bearish.
The main characteristics include:
- A small real body located near the top of the candle’s range
- A long lower wick, usually at least two times the size of the body
- Little to no upper wick
- Formation after a clear downtrend
When these conditions are met, the candle reflects rejection of lower prices, which is the core signal behind the pattern.
Hammer Candlestick Psychology Explained
The psychology behind the hammer candlestick is what makes it valuable. It represents a battle between sellers and buyers, with buyers gaining the upper hand by the close.
Early in the session, sellers remain confident and push prices lower, continuing the existing downtrend. As prices drop, buyers see value and step in aggressively, absorbing sell orders and driving the price back up. By the close, sellers have lost momentum, and buyers have proven they are willing to defend lower levels.
Hammer vs Hanging Man Candlestick
The hammer candlestick is often confused with the hanging man because they look almost identical. The difference lies in context, not appearance.
A hammer forms after a downtrend and suggests a potential bullish reversal. A hanging man appears after an uptrend and warns of possible bearish weakness. Reading the surrounding trend correctly is essential, as the same candle shape can mean very different things depending on where it forms.
How to Identify a Valid Hammer Candlestick
Identifying a valid hammer candlestick requires more than spotting a long lower wick. The surrounding price action plays a crucial role in determining its reliability.
A hammer is most meaningful when it appears:
- After a sustained or clearly visible downtrend
- Near a support level or demand zone
- Following strong bearish momentum that begins to weaken
When these conditions align, the pattern carries far more weight than when it appears randomly in a sideways market.
Hammer Candlestick in Different Markets
The hammer candlestick works across multiple financial markets because it reflects universal trader behavior. Fear, panic selling, and value buying occur in all liquid markets.
In forex trading, hammers often appear near key support zones or after news-driven sell-offs. In stock markets, they commonly form after earnings reactions or broader market pullbacks. In crypto markets, where volatility is higher, hammer candles can be frequent but require stronger confirmation due to sharp intraday swings.
How to Trade the Hammer Candlestick Pattern
Trading a hammer candlestick successfully depends on confirmation and risk control. Entering blindly after a single candle can lead to false signals.
Entry Strategy
A common approach is to wait for confirmation on the next candle. Traders look for a bullish close above the hammer’s high, which shows follow-through buying pressure.
This confirmation reduces the risk of entering while sellers are still active. Conservative traders may also wait for a retest of the hammer’s midpoint before entering.
Stop Loss Placement
Stop losses are typically placed below the low of the hammer’s lower wick. This level represents the point where the bullish idea is invalidated.
Placing stops too tight can result in unnecessary losses, while placing them too far increases risk. The hammer’s structure provides a natural reference point for balanced risk placement.
Take Profit Targets
Profit targets depend on market context rather than the hammer itself. Many traders target:
- The nearest resistance level
- A previous swing high
- A fixed risk-to-reward ratio, such as 1:2 or 1:3
Using structure-based targets helps keep expectations realistic and disciplined.
Using Indicators to Confirm a Hammer Candlestick
While the hammer candlestick is a price-action pattern, confirmation tools can improve accuracy. Indicators should support the signal, not replace it.
Common confirmations include:
- Oversold readings on RSI or Stochastic Oscillator
- Price reacting at a moving average or support zone
- Increased volume during or after the hammer candle
When multiple factors align, the probability of a successful reversal increases.
Common Mistakes Traders Make With Hammer Candlesticks
Many traders misuse the hammer candlestick by focusing only on its shape. This often leads to low-quality trades and frustration.
Frequent mistakes include trading hammers in sideways markets, ignoring trend context, and entering without confirmation. Another common error is assuming every hammer leads to a strong reversal, when in reality it often signals only a short-term bounce.
Hammer Candlestick Example in Real Trading
In real trading conditions, a hammer candlestick often forms after a sharp sell-off into a support level. The long lower wick shows rejection of lower prices, and the next candle confirms buyer strength by closing higher.
This sequence reflects a shift in market sentiment rather than a guaranteed trend change. Experienced traders treat it as a clue, not a promise.
Is the Hammer Candlestick Reliable?
The hammer candlestick is reliable when used correctly and in the right context. On its own, it is a warning signal, not a full trading system.
Its strength comes from combining it with trend analysis, support and resistance, and confirmation candles. Traders who respect these conditions tend to use the hammer more effectively than those who rely on it in isolation.
Final Thoughts
The hammer candlestick remains one of the most valuable single-candle reversal patterns in technical analysis. Its strength lies in the clear story it tells about shifting control from sellers to buyers.
By focusing on context, confirmation, and disciplined risk management, traders can use the hammer candlestick as a practical and reliable tool rather than a guessing signal. When applied with patience and structure, it can significantly improve timing and trade quality across different markets.