Fibonacci retracement is one of the most widely used technical analysis tools in financial markets. Traders rely on it to identify potential price reversal areas, measure pullbacks, and improve trade timing across forex, stocks, crypto, and commodities. When used correctly, it helps structure and rationalize price movements that may otherwise appear random.
This guide explains Fibonacci retracement clearly and practically, making it suitable for beginners while still offering depth for experienced traders. You will learn what it is, how it works, why traders trust it, and how to use it effectively without overcomplicating your charts.
What Is Fibonacci Retracement?
Fibonacci retracement is a technical analysis tool that identifies potential support and resistance levels during a market pullback. It is based on key ratios derived from the Fibonacci sequence, a mathematical pattern found widely in nature and financial markets.
In trading, Fibonacci retracement levels help traders anticipate where the price may pause, reverse, or continue its trend. These levels act as reference points rather than guaranteed turning points, making them most effective when combined with other technical tools.
The Origin of Fibonacci Ratios in Trading
The Fibonacci sequence is a series of numbers where each number is the sum of the two preceding ones. From this sequence come ratios that appear repeatedly in natural systems, architecture, and financial markets.
In trading, the most commonly used Fibonacci ratios are:
- 23.6%
- 38.2%
- 50% (not a true Fibonacci ratio but widely used)
- 61.8%
- 78.6%
These percentages represent potential retracement levels where the price may pause or reverse before continuing in its original direction.
How Fibonacci Retracement Works in Trading
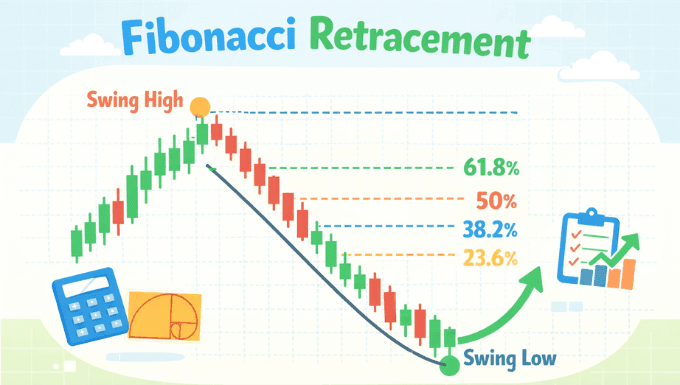
Fibonacci retracement works by measuring the distance between a significant high and low on a price chart. The tool then divides that distance using Fibonacci ratios to highlight potential areas of interest.
In an uptrend, traders draw the retracement from the swing low to the swing high. In a downtrend, it is drawn from the swing high to the swing low. The resulting horizontal lines act as possible support or resistance zones where price reactions often occur.
These levels do not predict exact turning points but instead highlight areas where market participants are likely to pay attention.
Understanding Key Fibonacci Levels
Each Fibonacci level has its own significance and role in market behavior.
23.6% Level
This shallow retracement often appears in strong trending markets. Price may briefly pull back to this level before continuing in the original direction, showing strong momentum.
38.2% Level
This level represents a moderate correction and is commonly respected in healthy trends. Many traders look for confirmation signals when the price reaches this area.
50% Level
Although not a true Fibonacci ratio, the 50% level is psychologically important. Markets often retrace about half of a previous move before resuming the trend.
61.8% Level
Often called the “golden ratio,” this level is one of the most watched by traders. A strong reaction here can indicate trend continuation or a potential reversal.
78.6% Level
This deeper retracement suggests weakening momentum. If the price holds this level, it may still resume the trend, but a break often signals a deeper reversal.
How to Draw Fibonacci Retracement
Drawing Fibonacci retracement correctly is essential for reliable analysis. Start by identifying a clear trend and a strong price move.
Follow these basic steps:
- Identify a clear swing high and swing low on the chart.
- Select the Fibonacci retracement tool on your trading platform.
- Draw from the start of the move to the end of the move, following the trend direction.
- Observe how the price reacts near the plotted levels.
Accuracy improves when the tool is applied to clear market structures rather than random or choppy price movements.
Using Fibonacci Retracement in Different Market Conditions
Fibonacci retracement can be applied across various market environments, but its interpretation changes depending on trend strength.
In a Uptrend
In an uptrend, traders look for the price to retrace to key Fibonacci levels before resuming upward movement. These areas can offer potential buying opportunities when confirmed by other signals.
In a Downtrend
During a downtrend, Fibonacci retracement helps identify potential resistance zones where the price may resume falling after a temporary bounce.
In Ranging Markets
When markets move sideways, Fibonacci levels may be less reliable. In such cases, traders often combine them with support and resistance zones or range boundaries.
Combining Fibonacci Retracement with Other Indicators
Fibonacci retracement works best when used alongside other technical tools rather than in isolation. Combining confirmation methods improves accuracy and reduces false signals.
Common tools used with Fibonacci retracement include:
- Trendlines to confirm overall direction
- Moving averages to assess trend strength
- Candlestick patterns for entry confirmation
- RSI or MACD to evaluate momentum
When multiple indicators align near a Fibonacci level, the probability of a meaningful price reaction increases.
Common Mistakes to Avoid When Using Fibonacci Retracement
Many traders misuse Fibonacci retracement by applying it without context or discipline. Avoiding common mistakes can significantly improve results.
- Drawing retracements on unclear or weak price moves
- Forcing Fibonacci levels to fit a desired trade idea
- Relying on a single level without confirmation
- Ignoring overall market structure and trend direction
Treat Fibonacci retracement as a guide, not a prediction tool.
Is Fibonacci Retracement Suitable for Beginners?
Fibonacci retracement is beginner-friendly once its basic logic is understood. While it may appear complex at first, it becomes intuitive with practice and chart observation.
Beginners benefit most by focusing on major levels, avoiding overanalysis, and combining Fibonacci with simple price action techniques. With consistent practice, it becomes a powerful addition to any trading strategy.
Final Thoughts on Fibonacci Retracement
Fibonacci retracement remains one of the most trusted and widely used tools in technical analysis. Its ability to highlight potential support and resistance zones makes it valuable for traders across all markets and timeframes.
When applied correctly and combined with sound risk management, Fibonacci retracement can improve trade timing, enhance confidence, and bring structure to trading decisions. Like any tool, its effectiveness depends on discipline, practice, and proper market understanding.