A fakeout is one of the most common and frustrating events that readers experience in financial markets. It happens when price appears to break out of a key level, only to reverse direction shortly afterward. Understanding how fakeouts work is essential for traders who want to avoid false signals, protect their capital, and make more informed trading decisions.
This guide explains the concept of a fakeout in clear, practical terms. You’ll learn how fakeouts form, why they happen, how to identify them, and how to trade more confidently around them.
What Is a Fakeout in Trading?
A fakeout occurs when the price of an asset briefly moves beyond a well-known support or resistance level, trendline, or chart pattern, but then quickly reverses direction instead of continuing the breakout.
In simple terms, the market gives the illusion of a breakout, attracts traders into a position, and then moves against them. This often results in losses for traders who enter too early or without confirmation.
Fakeouts can happen in any market, including forex, stocks, indices, and cryptocurrencies. They are especially common during periods of low liquidity, high volatility, or major news releases.
Why Fakeouts Happen in the Market
Fakeouts are not random events. They are a natural outcome of how markets function and how traders behave around key price levels.
One major reason is the concentration of orders around support and resistance. Many traders place buy or sell orders at the same levels, making those zones attractive targets for larger market participants.
Another reason is liquidity hunting. Large players may push prices beyond a key level to trigger stop-loss orders and collect liquidity before reversing prices in the opposite direction.
Emotional trading also plays a role. Fear of missing out causes traders to jump into breakouts too early, while panic selling or buying accelerates the reversal once the move fails.
Common Types of Fakeouts
Fakeouts can appear in different forms depending on market structure and conditions. Understanding the main types helps traders recognize them faster.
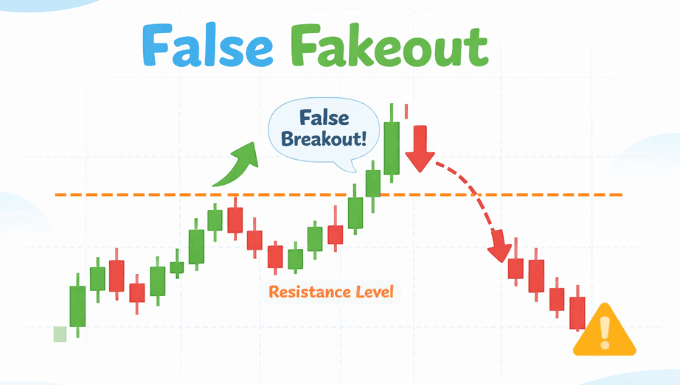
Support and Resistance Fakeouts
These occur when the price briefly breaks above resistance or below support but fails to hold beyond the level. The move looks convincing at first, but the price quickly returns within the previous range.
Trendline Fakeouts
A trendline fakeout happens when the price breaks a rising or falling trendline but does not follow through. This often traps breakout traders before the price resumes its original trend.
Range Breakout Fakeouts
Markets that move sideways for extended periods often produce false breakouts. Price may break above or below the range only to reverse once breakout traders enter the market.
News-Driven Fakeouts
Economic announcements can cause sudden price spikes that look like real breakouts. Once the initial reaction fades, the market often retraces sharply.
How to Identify a Fakeout Before It Traps You
While no method is perfect, several signals can help identify potential fakeouts before committing to a trade.
Weak Breakout Volume
A true breakout is usually supported by strong volume. If price breaks a level with low or declining volume, the move may lack conviction.
Lack of Candle Follow-Through
When price breaks a key level but fails to close strongly beyond it, the breakout may be unreliable. Small-bodied candles or long wicks are common warning signs.
Rejection at Key Levels
Sharp rejections from support or resistance, especially with long wicks, often signal that the market is rejecting higher or lower prices.
Breakouts Against the Higher Timeframe Trend
Fakeouts are more common when a lower timeframe breakout goes against the dominant trend on higher timeframes.
How to Avoid Fakeouts in Trading
While fakeouts cannot be eliminated entirely, traders can reduce their impact by using smarter confirmation techniques.
Wait for Confirmation
Instead of entering as soon as the price breaks a level, wait for a candle close beyond that level or a successful retest before entering.
Use Multiple Timeframes
Confirm the breakout direction using higher timeframes. A breakout aligned with the broader trend has a higher probability of success.
Combine Technical Indicators
Indicators such as volume, RSI, or moving averages can help confirm whether a breakout has real strength or is likely to fail.
Avoid Overtrading Key Levels
Not every touch of support or resistance requires a trade. Waiting for high-quality setups reduces exposure to false signals.
Fakeouts vs Breakouts: Key Differences
Understanding the difference between a fakeout and a genuine breakout is essential for consistent trading.
A true breakout shows strong momentum, follow-through, and sustained price movement beyond a key level. A fakeout, by contrast, lacks continuation and quickly reverses direction.
Traders who focus on confirmation rather than anticipation are better positioned to avoid being trapped by false moves.
Is Trading Fakeouts a Viable Strategy?
Some experienced traders intentionally trade fakeouts by entering after the market reverses from a failed breakout. This approach requires strong discipline, fast execution, and a deep understanding of market structure.
For beginners, it is generally safer to focus on avoiding fakeouts rather than trying to profit from them. Mastery comes with experience, patience, and consistent risk management.
Final Thoughts on Fakeouts
Fakeouts are a natural part of trading and cannot be completely avoided. However, understanding why they happen and learning how to recognize them can significantly improve decision-making and reduce unnecessary losses.
By combining market structure analysis, confirmation techniques, and disciplined risk management, traders can navigate fakeouts with greater confidence and consistency. Over time, recognizing these deceptive moves becomes a valuable skill that separates reactive traders from strategic ones.