Bollinger Bands are one of the most widely used technical analysis tools in trading. They are an essential indicator for traders to assess market volatility and price trends.
In this guide, we will break down what Bollinger Bands are, how they are constructed, and how they can be applied in real-world trading strategies.
What Are Bollinger Bands?
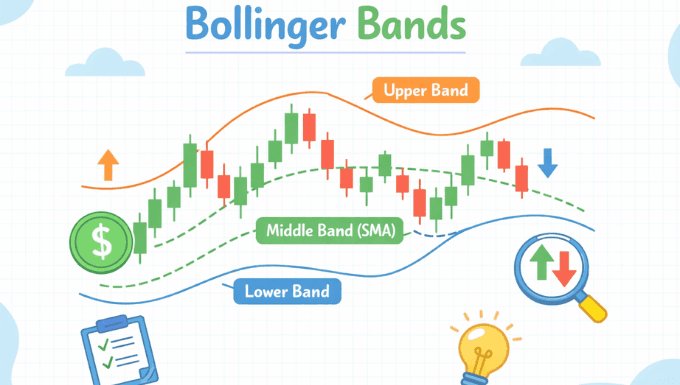
Bollinger Bands, developed by John Bollinger in the 1980s, are a set of lines plotted on a price chart that help traders understand price volatility and potential entry or exit points. The bands consist of three components:
- The Middle Band: This is the simple moving average (SMA) of the price, usually set to a 20-period SMA.
- The Upper Band: The upper band is calculated by adding two standard deviations to the middle band.
- The Lower Band: The lower band is calculated by subtracting two standard deviations from the middle band.
These bands expand and contract based on market volatility. When volatility increases, the bands widen, and when volatility decreases, the bands tighten.
How Do Bollinger Bands Work?
Bollinger Bands work by providing a dynamic range for price movement. The price typically fluctuates between the upper and lower bands. The key principle behind Bollinger Bands is that price will often stay within the bands, but extreme price action may signal overbought or oversold conditions.
- Overbought Conditions: When the price reaches the upper band, it suggests that the asset may be overbought, meaning the price could soon reverse or consolidate.
- Oversold Conditions: When the price reaches the lower band, it signals that the asset may be oversold, indicating a potential upward reversal.
Traders use these signals to determine entry or exit points. However, the bands are not meant to be used in isolation. It’s crucial to combine them with other indicators to form a more comprehensive trading strategy.
How to Calculate Bollinger Bands
The formula to calculate Bollinger Bands is straightforward:
- Middle Band (SMA): The moving average of the closing prices over a specified period (usually 20 periods).
- Upper Band: Middle Band + (2 x Standard Deviation of the price over the same period).
- Lower Band: Middle Band – (2 x Standard Deviation of the price over the same period).
Example Calculation:
- 20-day moving average (Middle Band): 100
- Standard deviation of the closing price over 20 days: 2
- Upper Band: 100 + (2 × 2) = 104
- Lower Band: 100 – (2 × 2) = 96
This means the upper and lower Bollinger Bands are set at 104 and 96, respectively, for this period.
Interpreting Bollinger Bands in Trading
Interpreting Bollinger Bands can be quite useful for traders, especially when combined with other technical indicators like the Relative Strength Index (RSI) or Moving Average Convergence Divergence (MACD).
1. Price Touching the Upper Band
When the price reaches or exceeds the upper band, it may indicate that the asset is becoming overbought. However, this doesn’t necessarily mean that a price reversal is imminent. In strong trends, the price may continue to move beyond the upper band for some time. Traders may wait for other confirmation signals before acting.
2. Price Touching the Lower Band
When the price touches or falls below the lower band, it can be a sign of oversold conditions. Similar to the upper band, this doesn’t automatically signal a reversal. In trending markets, the price may continue to trade below the lower band, so it’s important to wait for additional indicators before making trading decisions.
3. Squeeze
One of the most important patterns to look for in Bollinger Bands is the squeeze. A squeeze occurs when the bands contract tightly, indicating low volatility. This typically happens before a significant price movement, as the market is building up energy. Traders often see this as a signal that a breakout could be imminent, either to the upside or downside.
Practical Applications of Bollinger Bands in Trading
Traders can apply Bollinger Bands in various ways, depending on their strategy and market conditions. Some of the most common trading strategies include:
1. The Bollinger Band Bounce
The Bollinger Band bounce is a strategy based on the assumption that the price will revert to the mean. When the price touches the upper or lower band, traders look for a price reversal towards the middle band. The strategy works best in sideways or consolidating markets where the price oscillates between the bands.
2. The Bollinger Band Breakout
The Bollinger Band breakout strategy takes advantage of a squeeze and the subsequent breakout. When the bands contract, indicating low volatility, traders anticipate a sharp price movement. A breakout above the upper band suggests a strong upward trend, while a breakout below the lower band signals a potential downward movement.
3. Using Bollinger Bands with Other Indicators
While Bollinger Bands are powerful on their own, they are most effective when used alongside other technical indicators. Here’s how you can combine them with other tools:
- RSI: Use RSI to confirm overbought or oversold conditions. If the price touches the upper band and the RSI is above 70 (overbought), it may indicate a reversal. Conversely, if the price touches the lower band and RSI is below 30 (oversold), it could signal a buying opportunity.
- MACD: Use MACD to confirm bullish or bearish momentum. A crossover of the MACD line above the signal line while the price is near the lower band can indicate a buying opportunity.
Advantages and Limitations of Bollinger Bands
Advantages:
- Adaptable to Different Market Conditions: Bollinger Bands work well in both trending and ranging markets.
- Easy to Interpret: The visual representation of the bands makes it easy for traders to spot potential trading opportunities.
- Versatile: Can be used with various asset classes like stocks, forex, and commodities.
Limitations:
- Lagging Indicator: As with most technical indicators, Bollinger Bands are based on historical data and may lag behind current market movements.
- False Signals: In strongly trending markets, the price may stay above the upper band or below the lower band for extended periods, potentially leading to false signals.
- Not a Standalone Tool: Bollinger Bands should not be used in isolation. It’s essential to combine them with other indicators for confirmation.
The Bottom Line
Bollinger Bands are a versatile and widely used tool for traders. By understanding how they are constructed, how to interpret their signals, and how to combine them with other indicators, traders can significantly enhance their market analysis and decision-making process. Whether you are a beginner or an experienced trader, mastering Bollinger Bands can add an important layer of insight to your trading strategy.
By incorporating Bollinger Bands into your trading plan, you’ll be better equipped to navigate volatile markets and identify profitable opportunities.