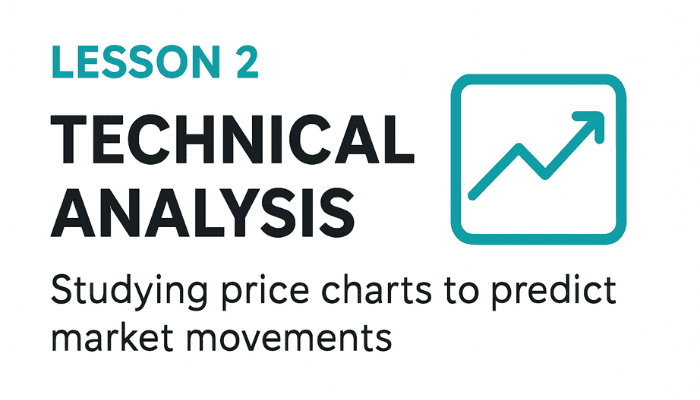
Technical analysis in Forex involves studying price charts to predict where the market may go next. Instead of focusing on news or economic reports, traders who use technical analysis rely on past price movements, chart patterns, and indicators.
If you’ve ever heard someone talk about “reading the charts,” they’re talking about technical analysis.
- What is Technical Analysis?
Technical analysis is the study of past price data to forecast future price direction. Traders believe that “history repeats itself,” and that prices often move in patterns. - The Core Beliefs of Technical Analysis:
- Price discounts everything: All news, events, and expectations are already reflected in the price.
- Prices move in trends: Once a trend starts (an uptrend, a downtrend, or sideways), it’s likely to continue until something changes.
- History repeats itself: Market patterns tend to recur because human behavior (fear and greed) stays the same.
- What Traders Look At:
- Charts: Line, bar, and candlestick charts are the foundation.
- Trends: Identifying whether the market is moving up, down, or sideways.
- Support and Resistance: Key levels where price tends to bounce or break.
- Indicators & Tools: Moving Averages, RSI, MACD, Fibonacci, etc.
- Why Technical Analysis Matters:
- Gives traders entry and exit points.
- Works on any time frame (from minutes to months).
- Helps manage risk with stop-loss and take-profit levels.
👉 Example: If EUR/USD has been bouncing from 1.1000 multiple times, technical traders may consider it a support level. They’ll look to buy near that level, expecting price to rise again.