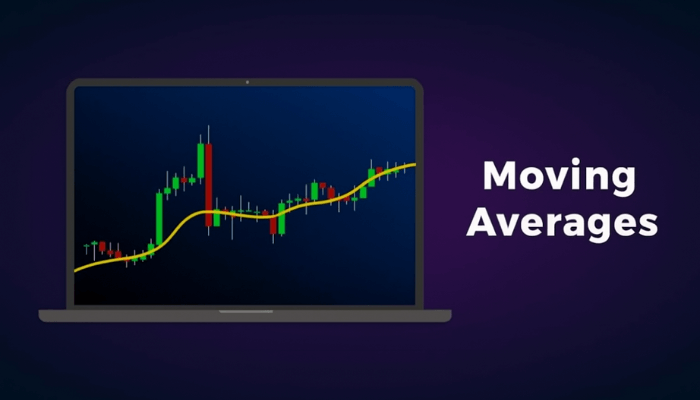
When you first look at a trading chart, price movements may seem chaotic—like random waves crashing on the shore. That’s where moving averages (MAs) come in. They help smooth out price action, making trends easier to see. Traders use moving averages to identify the direction of a trend, find potential entry and exit points, and confirm trading signals.
This lesson will help you understand how moving averages work, the different types, and how to apply them effectively in your forex trading strategy.
What Is a Moving Average?
A moving average is a line plotted on a chart that represents the average price of a currency pair over a specific number of periods. The “moving” part means the average updates continuously as new price data becomes available.
For example, if you use a 20-day moving average, the line shows the average closing price of the last 20 days. When a new day’s price appears, the oldest one drops off, and the new one gets added to the calculation.
This smooths out price fluctuations, helping you focus on the overall direction rather than short-term noise.
Why Moving Averages Matter
Moving averages serve three key purposes:
- Trend Identification – They show whether a market is trending up, down, or sideways.
- Support and Resistance – MAs often act as dynamic levels where prices may bounce or reverse.
- Signal Generation – Crossovers between different moving averages can indicate potential trade opportunities.
Types of Moving Averages
There are several types of moving averages, but two are the most popular among forex traders:
1. Simple Moving Average (SMA)
The SMA calculates the arithmetic mean of prices over a set number of periods.
For instance, a 10-day SMA adds up the closing prices of the last 10 days and divides by 10.
The SMA gives equal weight to all prices in the calculation. While it provides a clear long-term view, it reacts slowly to sudden market changes because older prices influence it equally as recent ones.
2. Exponential Moving Average (EMA)
The EMA gives more weight to recent prices, making it more responsive to current market conditions.
Traders often prefer EMAs for short-term trading because they react faster to price changes.
Common settings:
- Short-term trend: 10 or 20-period EMA
- Medium-term trend: 50-period EMA
- Long-term trend: 100 or 200-period EMA
How Moving Averages Work in Practice
Moving averages help you visually confirm a trend:
- When price is above the moving average, the market is generally bullish.
- When the price is below the moving average, the market is generally bearish.
Example:
If EUR/USD stays consistently above the 50 EMA, traders might look for buy setups.
If it trades below, they might look for sell setups.
The Crossover Strategy
A crossover occurs when two moving averages intersect on a chart. This often signals a potential trend reversal or continuation.
Common setup:
- Golden Cross: When a shorter MA (e.g., 50 EMA) crosses above a longer MA (e.g., 200 EMA). This suggests a bullish trend.
- Death Cross: When a shorter MA crosses below a longer MA. This indicates a bearish trend.
These signals are simple yet powerful when combined with other indicators or chart patterns.
Moving Averages as Dynamic Support and Resistance
Unlike static levels drawn horizontally, moving averages move with price—making them dynamic support and resistance.
For example:
- In an uptrend, the 20 EMA might act as a support line where the price tends to bounce.
- In a downtrend, the same EMA can become resistance, where the price rejects and continues falling.
Traders often look for price action signals (like pin bars or engulfing candles) around these levels to confirm trades.
Choosing the Right Moving Average
There’s no one-size-fits-all setting. The best MA depends on:
- Your trading style:
- Day traders prefer short EMAs (10–20).
- Swing traders use medium MAs (50–100).
- Long-term traders rely on longer MAs (200+).
- Market volatility:
More volatile pairs might require smoother (longer) averages to reduce false signals.
The goal is to use moving averages that align with your strategy and the time frame you trade.
Common Mistakes When Using Moving Averages
- Relying on MAs alone: Always confirm signals with other indicators (like RSI, MACD, or support/resistance).
- Using too many MAs: Keep your chart clean. Two or three are enough.
- Ignoring the market condition: MAs work best in trending markets, not sideways ones.
Combining Moving Averages with Other Indicators
You can combine moving averages with other tools for stronger confirmation:
- EMA + RSI: Use EMA for trend direction and RSI for entry timing.
- EMA + MACD: Confirm momentum and direction before entering trades.
- EMA + Support/Resistance: Identify key levels and confirm trend continuation.
This layered approach increases accuracy and confidence.
Key Takeaways
- Moving averages help identify trends and smooth out noise.
- The SMA is slower but more stable, while the EMA reacts more quickly to changes.
- Crossovers provide strong trading signals.
- MAs can act as dynamic support and resistance.
- Always combine MAs with other tools for the best results.