
In forex trading, there are countless tools and indicators traders use to understand price movement. One of the most popular — and often misunderstood — is the Fibonacci tool. Traders around the world rely on Fibonacci retracement and extension levels to identify potential support and resistance zones, time their entries, and even set profit targets.
But why is Fibonacci so powerful? The answer lies in mathematics, human psychology, and the fact that so many traders watch these same levels, creating a self-fulfilling cycle.
In this lesson, you’ll learn:
- What Fibonacci retracements and extensions are.
- How to use them in trending markets.
- Why they work best when combined with other tools.
- Practical tips for applying Fibonacci in real trading.
By the end, you’ll have a solid foundation for using Fibonacci to improve your trading decisions.
What Is Fibonacci?
The Fibonacci sequence is a famous set of numbers where each number is the sum of the two before it. For example:
0, 1, 1, 2, 3, 5, 8, 13, 21, and so on.
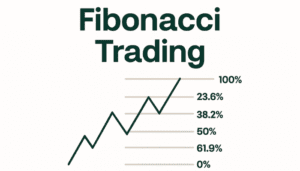
When you divide these numbers in certain ways, they produce ratios like 0.236, 0.382, 0.500, 0.618, and 0.786. These ratios are the backbone of Fibonacci retracement and extension levels in trading.
Traders apply these ratios to price charts to find areas where the market might “pull back” before continuing in its main direction.
Fibonacci Retracement Levels
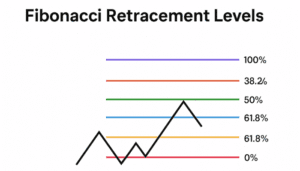
A retracement happens when the price temporarily moves against the main trend. Fibonacci retracement levels are horizontal lines that mark potential support or resistance zones during these pullbacks.
How It Works:
- In an uptrend: Traders look to buy at retracement levels (like 38.2%, 50%, or 61.8%).
- In a downtrend: Traders look to sell at retracement levels during price pullbacks.
The idea is simple: If the market is trending, it rarely moves in a straight line. Instead, it “breathes” — moving forward, pulling back, and then continuing. Fibonacci levels help traders predict where those pullbacks might end.
Why Do Fibonacci Retracements Work?
The truth is, Fibonacci retracements don’t always work. Price won’t bounce at these levels every single time. However, many traders around the world watch them closely, place trades at those levels, and set stop-loss or take-profit orders based on them.
This collective behavior makes Fibonacci levels a sort of self-fulfilling prophecy. If enough traders believe that 61.8% is an important support, chances are, price will react there.
Combining Fibonacci With Other Tools
One of the best ways to increase the accuracy of Fibonacci retracements is to combine them with other technical tools. For example:
- Support and Resistance: If a Fibonacci level aligns with a strong horizontal level, it’s more reliable.
- Trend Lines: A Fibonacci retracement that intersects with a trend line carries more weight.
- Candlestick Patterns: Reversal patterns (like pin bars or engulfing candles) forming at Fibonacci levels give extra confirmation.
This “confluence” approach increases the probability of success because you’re stacking multiple signals.
Fibonacci Extensions
While retracements are used to find pullback zones, Fibonacci extensions help traders project how far a trend might go. They act as potential profit targets.
Common extension levels include: 61.8%, 100%, 161.8%, and 261.8%.
Example:
- If you bought EUR/USD at a retracement level in an uptrend, you might set your profit target at the 161.8% extension level.
- Since many traders use these levels, extensions often become turning points in the market.
Swing Highs and Swing Lows
To apply Fibonacci levels, you first need to identify the swing high and swing low on your chart:
- Swing High: A candlestick peak with at least two lower highs on either side.
- Swing Low: A candlestick bottom with at least two higher lows on either side.
You draw the Fibonacci retracement tool from swing low to swing high (in an uptrend) or swing high to swing low (in a downtrend). The tool will then plot the retracement levels automatically.
Practical Example of Fibonacci in Forex
Imagine EUR/USD is in an uptrend:
- You identify a swing low at 1.0800 and a swing high at 1.1000.
- Applying Fibonacci retracement, you get levels at:
- 38.2% = 1.0924
- 50% = 1.0900
- 61.8% = 1.0876
Price pulls back to 1.0900 (50% level), shows a bullish candlestick pattern, and then continues upward. You enter at 1.0900, place your stop-loss below 1.0876 (61.8% level), and target the 161.8% extension level at 1.1200.
This is how Fibonacci combines retracement (entry) with extension (target).
Strengths and Limitations
Strengths:
- Simple to apply on charts.
- Works well in trending markets.
- Popular among traders, creating strong self-fulfilling reactions.
Limitations:
- Doesn’t work in sideways or choppy markets.
- Levels are zones, not exact prices.
- Should not be used alone — confluence is key.
Key Takeaways
- Fibonacci is based on a mathematical sequence that translates into trading ratios.
- Retracements help identify potential entry points in trending markets.
- Extensions are used for setting realistic profit targets.
- The tool works best when combined with support/resistance, trend lines, and candlestick patterns.
- Fibonacci is about probabilities, not guarantees. Use it wisely and manage risk.